
Introduction
Dash is an open-source framework for building analytical web applications using Python. It is particularly useful for creating interactive, data-driven dashboards without requiring extensive knowledge of web development. Dash is ideal for data scientists and analysts who want to visualize complex datasets and share interactive results with others.
Dash framework for Python
In this article you will learn the basics about Dash-based building data apps in Python.
Don’t hesitate to explore the user-friendly Dash documentation on:
Get help from further resurces:
Dash installation
Dash is an external library and is not included in the Python standard library. Therefore, it requires a separate installation. Ensure you install a version that meets the specific needs of your application.
Getting started with the Dash library as a Python developer is straightforward, regardless of the operating system you are working on. Just open a terminal window (or command prompt) and install Dash with pip or conda following the commands below.
If you don’t have pip or Conda installed, start with the tutorial(s) that will guide you through this necessary step:
Install with pip
In terminal window, execute the command:
pip install dash==2.17.0
The version specified in the command (e.g., 2.17.0) should be adjusted to suit the requirements of your application. It is best to use the latest stable release of Dash, which can be checked and verified here.
Install with conda
In terminal window, execute the command:
conda install -c conda-forge dash
For the efficient development of interactive Python applications, you will also need other libraries, such as Plotly, Pandas or SciPy. So, it is a good idea to create a new virtual environment with Conda right away and add into it other modules over time.
conda info --envs                       # Active environment shown with *; on Mac Pro activate base for Miniforge3_x86
conda create -n graphing python=3.8     # replace 'graphig' with custom name
conda activate graphing
pip install dash==2.17.0
Select development environment (IDE)
Coding in the Terminal
In the terminal window navigate to the desired location and create a new Python file, e.g. dash_app.py
touch dash_app.py
Edit the file in your preferred CLI text editor (Nano, Vim, mcedit, etc.) or VSC editor with GUI and go to Dash import section in this tutorial.
Coding in the JupyterLab
In the terminal window execute the command provided below to start a new JupyterLab session (assuming you have Jupyter installed).
jupyter lab
If you don’t have a Jupyter installed, start with the tutorial that will guide you through this necessary step:
Once you have launched the Jupyter Development Environment in a browser window, navigate to the desired location in the file system and open a new file under the Python kernel.
Dash import
Import Dash library
Importing dash with import dash initializes the Dash library and provides access to the core functionalities of the Dash framework.
import dash
Importing Dash with import dash does not bring in all commonly used submodules such as html, dcc, callback, Output, Input. To use these components, you need to import them separately with the recommended import statement.
Import Dash components
from dash import Dash, html, dcc, callback, Output, Input
According to the latest Dash documentation, importing submodules directly with from dash import ... is sufficient. This import statement brings in the necessary components directly, making the code cleaner and more efficient. No need for an additional import dash before using this statement.
Dash application
A Dash app is a web application framework designed for building interactive data visualizations using Python. It typically includes sections for importing libraries, defining global variables/settings, setting up the layout with app.layout, implementing interactivity through callbacks and deploying the server to run the app. This structure allows users to build dynamic dashboards that respond to user inputs in real time.
These 5 sections listed below, work together to create a functional and interactive Dash app, enabling the visualization and exploration of data in a dynamic way.
1. Imports
Import necessary libraries like Dash, dash core components, dash html components and Plotly.
(see section Dash import)
from dash import Dash, dcc, html, Input, Output
import plotly.express as px                     # optional, useful if you want to use Plotly Express graphs
2. Global variables or settings
Define any global variables or settings needed for the app, such as datasets or configuration options or common inline styles.
df = px.data.tips()                                                             # dataframe from example dataset
fruits = ["Apples", "Oranges", "Bananas", "Grapes"]                             # custom data array
spacing_style = {'padding': '5px', 'marginTop': '20px', 'marginBottom': '20px'} # some CSS style settings
3. Layout of the application
Define the layout of the app using app.layout = [] statement, which includes all static components and the structure of the interface.
(see section Dash components)
app = Dash(__name__)

app.layout = [
    dcc.Dropdown(id='input-box', options=[{'label': fruit, 'value': fruit} for fruit in fruits],
        value=fruits[0]),
    html.Div(id='output-div', style="spacing_style"),
    dcc.Graph(id='example-graph')
]
The app.layout in a Dash application is highly customizable to fit your needs. It can include a variety of dash components such as multiple graphs, tables, sliders, dropdowns and other widgets to facilitate interactive communication with users. This flexibility allows you to build complex, data-driven dashboards that can respond to user inputs in real-time, providing a dynamic and engaging user experience.
…about the Dash components in the section below, including:
4. Callbacks
Implement callback functions that define the interactivity of the app. These functions specify how inputs (user interactions) update the outputs (displayed components).
(see section Dash dependencies and callbacks)
@app.callback(
    Output('output-div', 'children'),
    Input('input-box', 'value')
)
def update_output(value):
    return f'You selected: {value}'
5. App Deployment
Run the app on a local server to make it accessible via a web browser.
if __name__ == '__main__':
    app.run(debug=True)
6. Use the app
All the sections 1-5 should be saved together in a file with a .py extension, for example, dash_app.py. To run the app, open a terminal and execute the command:
python dash_app.py
Then, your app can be explored in any web browser at http://127.0.0.1:8050.
Try the Minimal Dash App example.
Minimal Dash App
1. Open Terminal: Navigate to your desired directory.
2. Create File: Create a new Python file dash_app.py.
touch dash_app.py
3. Edit File: Open the file in a text editor and copy-paste the following code snippet:
# Import Dash components
from dash import Dash, html, dcc
# Create Dash app instance
app = Dash()
# Define app layout
app.layout = [
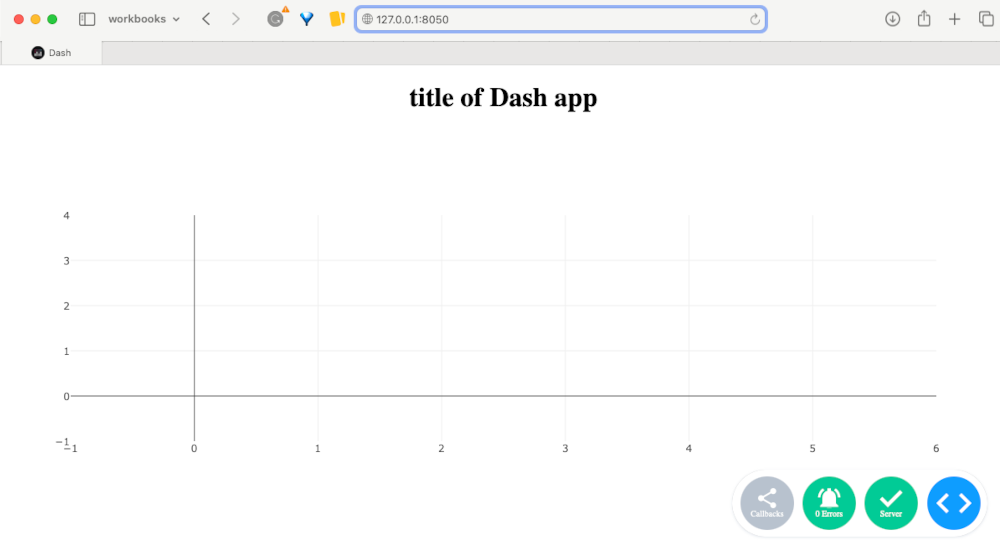
html.H1(children='title of Dash app', style={'textAlign':'center'}),
dcc.Graph(id='bar-graph')
]
# Define app callbacks (if any)
# Deploy app on the local Python server
if __name__ == '__main__':
app.run(debug=True)
What the script does?
This setup creates a basic interactive web application with a title and a placeholder for a graph.
The provided code:
- initializes a Dash application by importing elementary components (
Dash,html,dcc), - creates an app instance (
app = Dash()) - and defines the layout with a centered title (
html.H1) and a graph object (dcc.Graph). The application layout is assigned toapp.layout.
Finally, the app is deployed on a local Python server with app.run(debug=True) when the script is run directly.
4. Run the App: Execute the following command in the terminal:
python dash_app.py
5. Explore: Open your web browser and navigate to http://127.0.0.1:8050 to see your app.
Dash components
Dash components are the building blocks of Dash application layout, enabling you to create interactive, web-based data visualizations using Python. Major categories of Dash components include:
- HTML components (
html): Basic HTML elements like headings, paragraphs, divs, etc. - Core Components (
dcc): Higher-level components like graphs, dropdowns, sliders, etc. - Dependencies :
Input,OutputandStatecomponents manage user input, display output, and track component state in Dash callbacks, enabling dynamic interactivity in the application.- Callbacks : Functions that enable interactivity by linking inputs and outputs.
These components are integrated into the layout of a Dash application to create a user interface that responds dynamically to user interactions. For example, a dropdown component can store options that filter or switch data on a plot interactively when selected by a user.
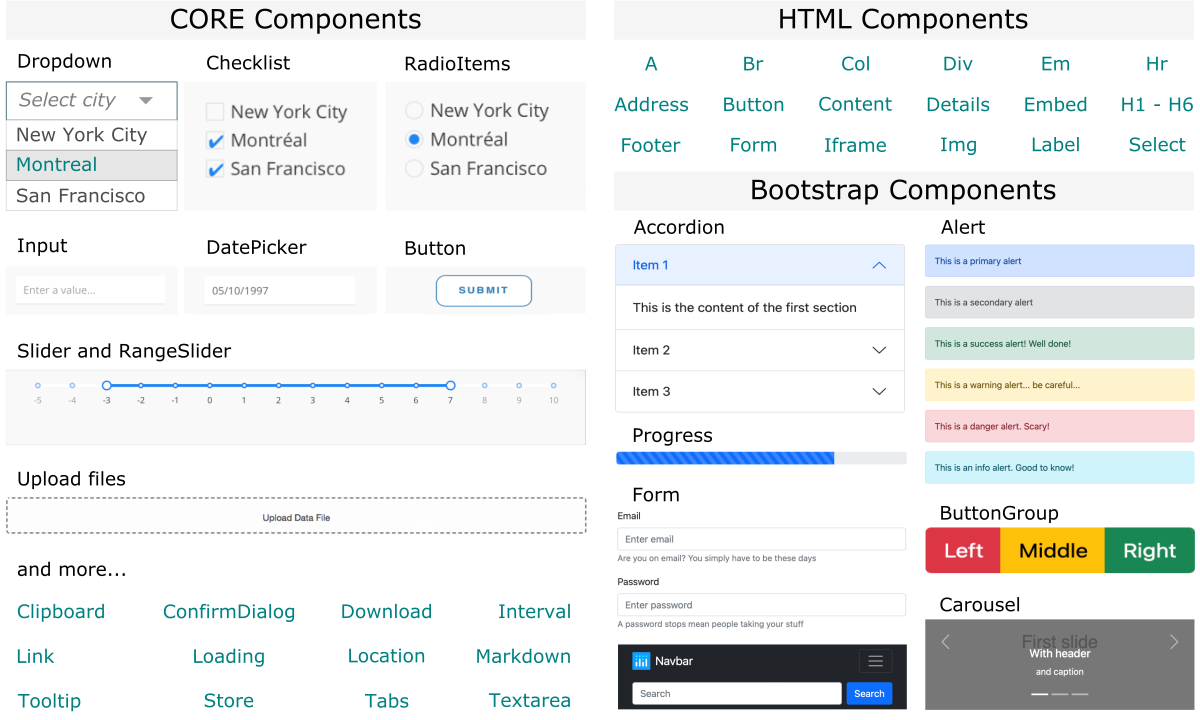 Examples of Dash widgets for interactive web applications, including Core, HTM and Bootstrap components.
Dash modules and example components
| module | description | example component | explanation |
|---|---|---|---|
html |
Basic HTML elements used for structuring the layout. | html.H1('Title of Dash App') |
Adds a main heading to the app layout. |
dcc |
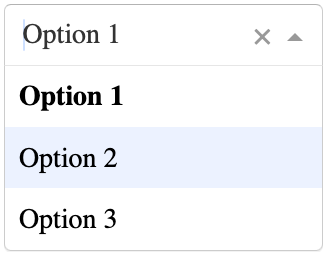
Higher-level components for graphs, dropdowns, and more. | dcc.Dropdown(options=[{'label': 'Option 1', 'value': '1'}]) |
Creates a dropdown menu with selectable options. |
Input |
Captures user input from components. | Input('dropdown', 'value') |
Monitors the selected value of the dropdown component. |
Output |
Defines outputs to update components. | Output('graph', 'figure') |
Updates the figure property of the graph component. |
callback |
Links inputs and outputs to create interactivity. | @app.callback(Output('graph', 'figure'), [Input('dropdown', 'value')]) |
Updates the graph based on the dropdown selection. |
HTML components
The html module in Dash provides a suite of components that mirror standard HTML elements, enabling you to structure the layout of your Dash application. These components include headings, paragraphs, divs, etc. They allow you to create a well-organized and visually appealing interface.
Each Dash HTML component formats and displays text or other content in a specific way, helping to arrange and organize visual elements on the app’s page. For example, a heading component makes text appear larger and bolder, while a division component groups selected elements together.
Commonly used HTML components
| component | description | example instance | rendering |
|---|---|---|---|
html.H1 |
main heading (h1) | html.H1('App Title') |
App Title |
html.H2 |
secondary heading (h2) | html.H2('Subtitle') |
Subtitle |
html.Div |
division or section (div) | html.Div(children='content goes here') |
content goes here |
html.P |
paragraph (p) | html.P('This is a paragraph.') |
This is a paragraph. |
html.Span |
inline container (span) | html.Span('This is a span.') |
This is a span. |
html.A |
hyperlink (a) | html.A('Link Text', href='https://dash.plotly.com/') |
Link Text |
html.Img |
image (img) | html.Img(src='path/to/image.jpg') |
 |
html.Button |
button (button) | html.Button('Click Me', id='button') |
|
html.Label |
label for form elements | html.Label('Label Text') |
|
html.Input |
input field | html.Input(type='text', value='input') |
|
html.Ul |
unordered list (ul) | html.Ul(children=[html.Li('Item 1'), html.Li('Item 2')]) |
• Item 1 • Item |
html.Ol |
ordered list (ol) | html.Ol(children=[html.Li('Item 1'), html.Li('Item 2')]) |
1. Item 1 2. Item 2 |
html.Li |
list item (li) | html.Li('List Item') |
• List Item |
For a comprehensive list of available Dash HTML components, check the official Dash documentation under the section Open Source Component Libraries → Dash HTML Components. This resource provides detailed information and examples to help you effectively use these components in your applications.
HTML component properties
When using Dash HTML components, you can customize them with various properties.
Properties of Dash HTML components are settings that customize how elements appear and behave. These properties are predefined attributes with fixed names that you can modify by assigning values. For example, the style property can change the element’s color or size by assigning specific values to these styles, e.g., style={"color": "red", "size": "24px"}.
Here’s a concise guide to the main properties and some useful tips:
| property | description | tips |
|---|---|---|
style |
a dictionary to define inline CSS styles | Use camelCase for properties (e.g., backgroundColor). |
className |
assigns CSS classes to the component | class is renamed to className in Dash |
id |
unique identifier for the component | Useful for callback targeting and CSS styling. |
Typically, properties are placed within the Dash calling function for a given component, immediately following the children attribute, which always comes first.
For example:
html.H1('Title of Dash App', style={'textAlign': 'center', 'color': 'red'}, id='app-title')
html.Div(children='content goes here', id='content-div', className='example-div', style={'backgroundColor': 'yellow', 'color': 'red'})
This example demonstrates the use of various HTML components and their properties in the Dash app layout, making the application well-organized and practically useful.
# Import Dash components
from dash import Dash, html

# Create Dash app instance
app = Dash()

# Define app layout using HTML components
app.layout = html.Div([
    # Main Heading
    html.H1('Title of Dash App', style={'textAlign': 'center', 'color': 'blue'}, id='main-heading'),
    # Section 1
    html.Div([
        html.H2('Section 1', style={'textAlign': 'left'}),
        html.P('This is a paragraph in section 1.', style={'fontSize': 14}),
        html.Ul([
            html.Li('List Item 1'),
            html.Li('List Item 2'),
            html.Li('List Item 3'),
        ]),
    ], style={'padding': '20px', 'border': '1px solid black'}),                 # style for a html.Div goes after the content
    # Section 2
    html.Div([
        html.H2('Section 2', style={'textAlign': 'left'}),
        html.P('This is a paragraph in section 2.', style={'fontSize': 14}),
        html.Img(src='https://via.placeholder.com/150', style={'display': 'block', 'margin': 'auto'}),
    ], style={'padding': '20px', 'border': '1px solid black', 'marginTop': '20px'}),
    # Section 3
    html.Div([
        html.H2('Section 3', style={'textAlign': 'left'}),
        html.P('This is a paragraph in section 3 with a button below.', style={'fontSize': 14}),
        html.Button('Click Me', id='button', style={'display': 'block', 'margin': 'auto', 'padding': '10px 20px'}),
    ], style={'padding': '20px', 'border': '1px solid black', 'marginTop': '20px'}),
])

# Deploy app on the local Python server
if __name__ == '__main__':
    app.run(debug=True)
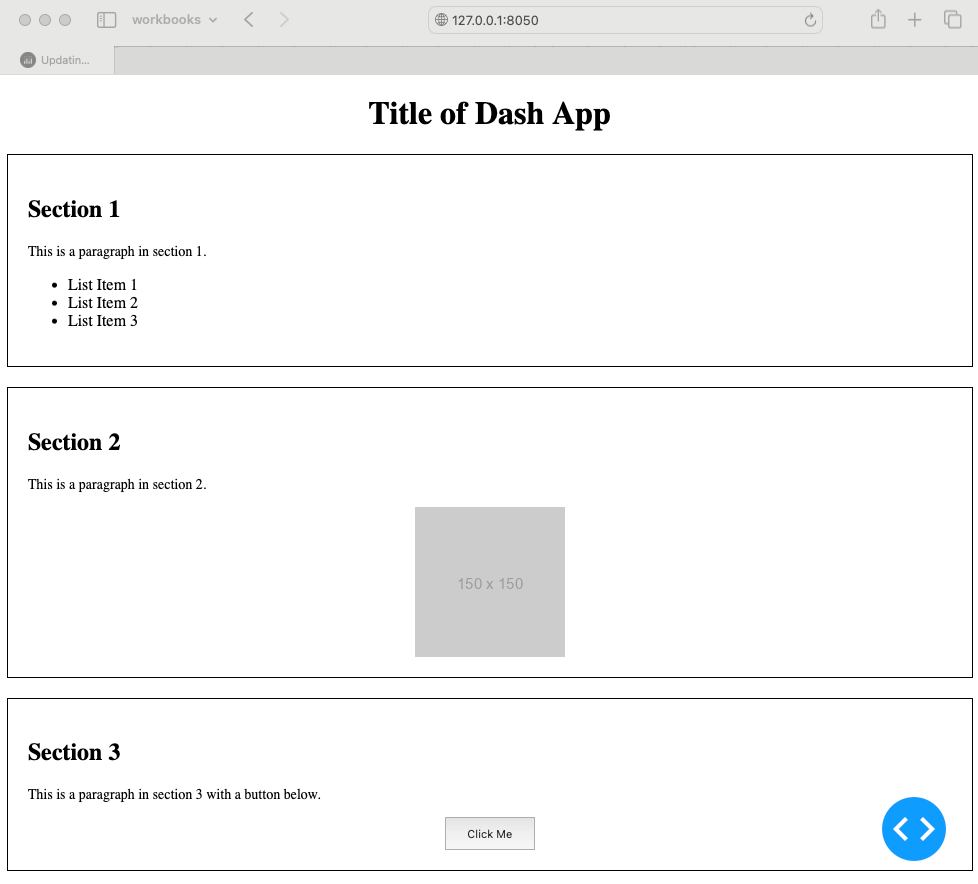
What the script does?
This code creates a Main Heading followed by 3 styled Sections in the app layout:
- Main Heading: Centered and styled with a specific color.
- Section 1: Includes a secondary heading, a paragraph, and an unordered list.
- Section 2: Contains a secondary heading, a paragraph, and a centered image.
- Section 3: Features a secondary heading, a paragraph, and a centered button.
Finally, the app is deployed on a local Python server with app.run(debug=True) when the script is run directly.
CSS Styles: inline vs variable vs className
When building Dash applications, repetitive style definitions can clutter your code, making it hard to read and maintain. Two effective solutions to this problem are using variables for common styles and/or assigning className defined within external CSS files.
Using variables for common styles
Using variables for common styles involves defining reusable style dictionaries and applying them to components. This method keeps your code clean and easy to manage by centralizing style definitions.
Here is the prvious example (shortened to first section only) with the styles converted to variables.
# Import Dash components
from dash import Dash, html

# Create Dash app instance
app = Dash(__name__)

# Define common styles
container_style = {'padding': '20px', 'border': '1px solid black', 'marginTop': '20px'}
heading_style = {'textAlign': 'left'}
centered_style = {'textAlign': 'center'}

# Define app layout using HTML components
app.layout = html.Div([
    html.H1('Title of Dash App', style=centered_style, id='main-heading'),

    html.Div([
        html.H2('Section 1', style=heading_style),
        html.P('This is a paragraph in section 1.', style={'fontSize': 14}),
        html.Ul([
            html.Li('List Item 1'),
            html.Li('List Item 2'),
            html.Li('List Item 3'),
        ]),
    ], style=container_style),
])

# Deploy app on the local Python server
if __name__ == '__main__':
    app.run(debug=True)
What changed: Repeated style properties are moved to variables above the app.layout and applied to multiple html components, reducing redundancy.
Using className for common styles
Using class names for common styles involves assigning CSS classes to components and defining styles in an external CSS file. This approach separates style definitions from your code, promoting better organization and maintainability.
Here is the prvious example (shortened to first section only) with the styles converted to CSS classes.
First, create an external CSS file (e.g., assets/custom_styles.css):
.container {
    padding: 20px;
    border: 1px solid black;
    margin-top: 20px;
}

.heading {
    text-align: left;
}

.centered {
    text-align: center;
}
When defining CSS classes in the external CSS file, remember that class names must be prefixed with a dot. For example, use .container instead of container. Then assign this class to the className property of the selected HTML component to apply the desired styles.
Then, update your Dash app to use the class names:
# Import Dash components
from dash import Dash, html

# Create Dash app instance
app = Dash(__name__)

# Define app layout using HTML components
app.layout = html.Div([
    html.H1('Title of Dash App', className='centered', id='main-heading'),

    html.Div([
        html.H2('Section 1', className='heading'),
        html.P('This is a paragraph in section 1.', style={'fontSize': 14}),
        html.Ul([
            html.Li('List Item 1'),
            html.Li('List Item 2'),
            html.Li('List Item 3'),
        ]),
    ], className='container'),
])

# Deploy app on the local Python server
if __name__ == '__main__':
    app.run(debug=True)
What changed: Styles definitions are moved to an external CSS file. HTML components are assigned className property instead of style, making the code cleaner and styles easier to manage.
DCC (core) components
The dcc (Dash Core Components) module in Dash provides a variety of higher-level components for creating interactive and data-driven applications. These components include graphs, dropdowns, radio buttons, sliders and more, enabling rich user interactions within your Dash application.
Each Dash Core Component is designed to facilitate user interactions and dynamic data visualization. For example, a dropdown component allows users to select from a list of options, while a graph component displays data visually with the ability to zoom in/out.
Commonly used DCC components
| component | description | example instance | rendering |
|---|---|---|---|
dcc.Graph |
plots interactive graphs | dcc.Graph(id='example-graph') |
 |
dcc.Markdown |
renders Markdown text | dcc.Markdown('**Bold Text**') |
Bold Text |
dcc.Dropdown |
dropdown menu for selecting options | dcc.Dropdown(options=[{'label': 'A', 'value': 'a'}]) |
 |
dcc.Input |
input box for text input | dcc.Input(id='input-box', type='text') |
|
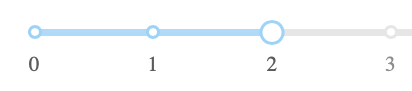
dcc.Slider |
slider for selecting numeric value | dcc.Slider(min=0, max=10, step=1, value=5) |
 |
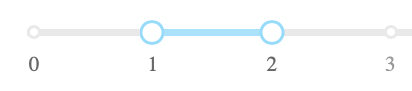
dcc.RangeSlider |
slider for selecting numeric range | dcc.RangeSlider(min=0, max=10, step=1, value=[3, 7]) |
 |
dcc.Checklist |
checklist for multiple selections | dcc.Checklist(options=[{'label': 'A', 'value': 'a'}]) |
 |
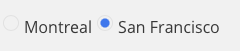
dcc.RadioItems |
radio buttons for single selection | dcc.RadioItems(options=[{'label': 'A', 'value': 'a'}]) |
 |
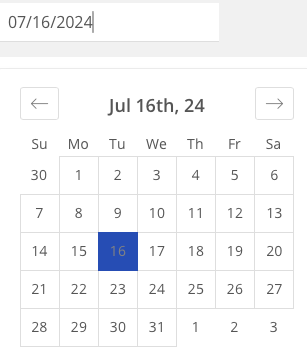
dcc.DatePickerSingle |
single date picker | dcc.DatePickerSingle(id='date-picker') |
 |
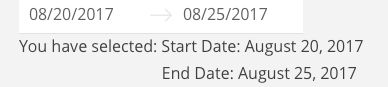
dcc.DatePickerRange |
range date picker | dcc.DatePickerRange(id='date-picker-range') |
 |
For a comprehensive list of available Dash Core Components, check the official Dash documentation under the section Open Source Component Libraries → Dash Core Components. This resource provides detailed information and examples to help you effectively use these components in your applications.
DCC component properties
Dash Core Components can have the same properties (style, className, id) as HTML components (see the HTML component properties section). These properties allow you to style and identify components within your application.
Not all Dash Core Components have a style property available, such as dcc.Slider. However, all components should have a className property, allowing you to style them by defining the corresponding CSS class in an external stylesheet (see the Using className for common styles section). This ensures you can still apply custom styles even when the style property is not supported.
Dash Core Components have many more properties specific to each component compared to HTML components. These properties enable functionalities such as specifying options for dropdowns or checklists, setting min and max boundaries for sliders, and using the value property to store the currently selected value. Other useful properties include:
disabled: Prevents the selection from being changed.persistence: Keeps selected values even after a page refresh.placeholder: Provides a hint to the user when nothing is selected.
For a comprehensive list of properties available for each DCC (core) component, it is recommended to review the dedicated documentation page. For example, see Dropdown Properties.
This example demonstrates the minimal use of various DCC (core)) components with their properties in the Dash app layout, showcasing how these components can be combined effectively for practical applications.
from dash import Dash, dcc, html
app = Dash(__name__)
spacing_style = {'padding': '5px', 'marginTop': '20px', 'marginBottom': '20px'}
app.layout = [
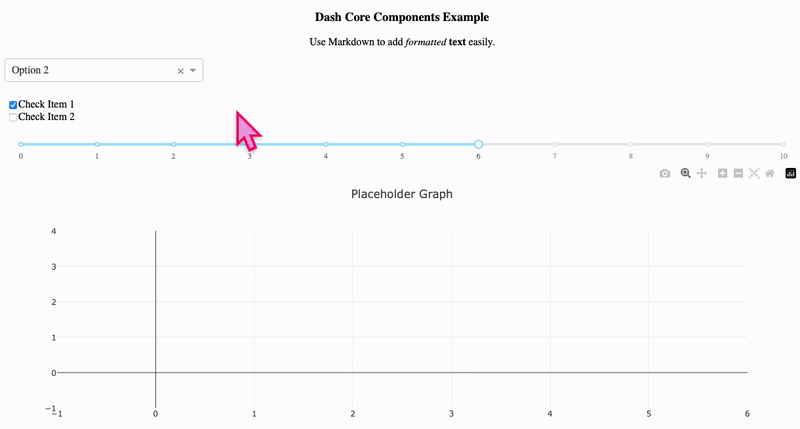
dcc.Markdown('''
### Dash Core Components Example
Use Markdown to add *formatted* **text** easily.
''', style={'textAlign': 'center'}),
dcc.Dropdown(id='dropdown', style={'width':'30%'},
options=[
{'label': 'Option 1', 'value': '1'},
{'label': 'Option 2', 'value': '2'},
{'label': 'Option 3', 'value': '3'}
],
value='1'
),
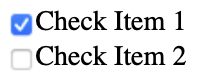
dcc.Checklist(id='checklist', style=spacing_style,
options=[
{'label': 'Check Item 1', 'value': '1'},
{'label': 'Check Item 2', 'value': '2'}
],
value=['1', '2']
),
dcc.Slider(id='slider', min=0, max=10, step=1, value=5), # Note: the Slider has no 'style' property, define className instead
dcc.Graph(id='example-graph',
figure={
'layout': {'title': 'Placeholder Graph'}
}
),
]
if __name__ == '__main__':
app.run(debug=True)
What the script does?
This example creates a Dash app with various Dash Core Components in the app layout:
- Markdown: Displays formatted text.
- Dropdown Menu: Allows the selection of an option.
- Checklist: Enables multiple selections.
- Slider: Allows selection of a numeric value.
- Graph Placeholder: A placeholder for future graph data.
Finally, the app is deployed on a local Python server with app.run(debug=True) when the script is run directly.
In the current state, the Dash Core Components are implemented with predefined values and options that can be changed by the user. However, they are not linked to any functionality or interactivity. To create interactive responses to changes in the selected values of these components, you need to implement callbacks.
Graph components
The dcc.Graph component in Dash is distinct from other Dash Core Components (dcc) widgets. While widgets like dropdowns, sliders, and checklists are typically used to update graphs, the dcc.Graph component itself is used to display data visually. These relationships between widgets and graphs bring interactivity, allowing users to dynamically change the data displayed in the graph.
Widgets such as dropdowns, sliders, and checklists are connected to the graph via callbacks. When a user interacts with these widgets, the graph updates in real time based on the user’s input, providing a highly interactive experience.
dcc.Graph vs. Plotly Graphs
The dcc.Graph component in Dash is a versatile tool for displaying interactive graphs and visualizations. Unlike other Dash Core Components that typically serve as inputs to update graphs, dcc.Graph serves as the display area for visual data. By linking dcc.Graph with other widgets like dropdowns and sliders, you can create highly interactive and dynamic visualizations.
Plotly graphs, which can be rendered within dcc.Graph, offer extensive customization options. Using either Plotly Express (e.g., px.bar) or Plotly Graph Objects (e.g., go.Bar), you can create a wide variety of graph types and customize them to fit your needs. This section explores how dcc.Graph can be used in conjunction with these Plotly tools to build powerful data visualizations.
| dcc.Graph | Plotly graph | |
|---|---|---|
| purpose | Integrates with Dash to provide interactive, dynamic visualizations within a web application. | Standalone graphing library used for creating static or interactive plots outside of Dash applications. |
| integration | Designed to work seamlessly with Dash callbacks, allowing for interactive updates. | Can be used in various environments like Jupyter Notebooks, standalone HTML files, and other web applications. |
| scope | Supports the full range of Plotly’s graphing library, including scatter plots, bar charts, line charts, heatmaps, and more. | Offers a comprehensive range of graph types similar to dcc.Graph, but without the built-in interactivity provided by Dash callbacks. |
The dcc.Graph component in Dash serves as a universal placeholder for any Plotly graph, enabling interactivity through Dash widgets. You can insert any Plotly graph by setting it as the value of the figure property of the dcc.Graph component. This allows you to leverage Plotly’s powerful graphing capabilities while integrating with Dash’s interactive features.
This example demonstrates how to use the dcc.Graph component in Dash using Plotly’s built-in data visualization capabilities.
from dash import Dash, dcc, html
import plotly.express as px

# Create a Plotly figure using manually eneterd sample x-y data
fig = px.bar(x=["Apples", "Oranges", "Bananas", "Grapes"], y=[4, 1, 2, 3])

# Create Dash app
app = Dash(__name__)

app.layout = html.Div([
    dcc.Graph(id='example-graph', figure=fig)
])

if __name__ == '__main__':
    app.run(debug=True)
What the script does?
This Dash app demonstrates the use of the dcc.Graph component to display a bar chart created with Plotly. The app consists of a bar chart that visualizes data on different types of fruits and their quantities.
The app is deployed on a local Python server with app.run(debug=True) when the script is run directly.
The dcc.Graph component holds the Plotly graph, and additional widgets like the slider can be used to add interactivity to the graph through Dash callbacks. This setup allows for a flexible and dynamic user experience.
Instead of directly defining the figure property in the dcc.Graph, you can provide only its id property and then dynamically insert the selected plot type in the callback. This makes your dcc.Graph placeholder flexible, allowing it to be interactively changed or updated based on user activity. See the example below.
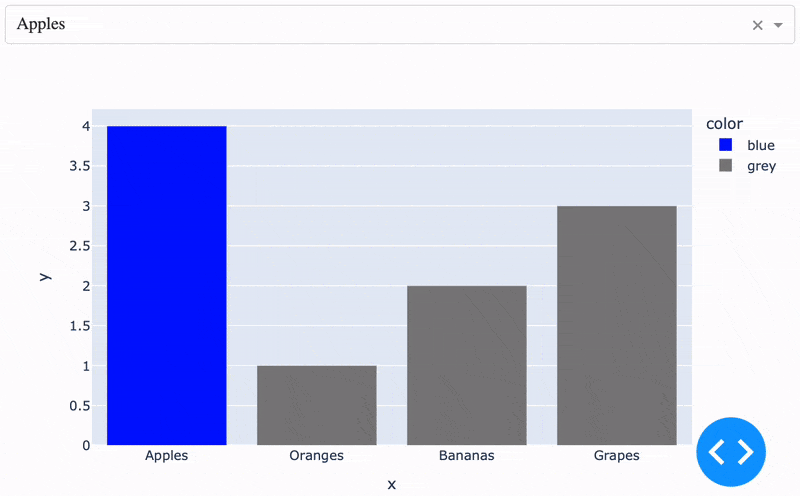
This updated Dash app includes a callback to demonstrate interactivity using the dropdown. The color of the bar chart will change for the fruit selected in the dropdown.
from dash import Dash, dcc, html, Input, Output
import plotly.express as px

# Initial data for the bar chart
fruits = ["Apples", "Oranges", "Bananas", "Grapes"]
amounts = [4, 1, 2, 3]

# Create Dash app
app = Dash(__name__)

app.layout = html.Div([
    dcc.Dropdown(
        id='fruit-dropdown',
        options=[{'label': fruit, 'value': fruit} for fruit in fruits],
        value=fruits[0]
    ),
    dcc.Graph(id='example-graph')
])

@app.callback(
    Output('example-graph', 'figure'),
    Input('fruit-dropdown', 'value')
)
def update_graph(selected_fruit):
    colors = ['blue' if fruit == selected_fruit else 'grey' for fruit in fruits]
    fig = px.bar(x=fruits, y=amounts, color=colors, color_discrete_map={"blue": "blue", "grey": "grey"}, category_orders={"x": fruits})
    return fig

if __name__ == '__main__':
    app.run(debug=True)
What the script does?
This Dash app demonstrates the use of the dcc.Graph component to display a bar chart created with Plotly Express wrapper. The app consists of a bar chart that visualizes data on different types of fruits and their quantities. The selected fruit is highlighted in blue.
- Layout: The app includes a
dcc.Dropdownabove thedcc.Graphto select a fruit.- By only specifying the
idproperty in thedcc.Graphcomponent, you can dynamically set thefigureproperty in theOutputof the callback function. This makes your graph placeholder versatile, allowing it to be updated interactively based on user selections or other activities.
- By only specifying the
- Callback: The update_graph function uses
px.barto change the color of the bar for the selected fruit to blue and the rest to grey.category_orders: The category_orders parameter ensures the bars are displayed in the order of the fruits list, maintaining the original order.color_discrete_map: Maps the colors to ensure the correct color assignment to the selected and non-selected fruits.
- Interactivity: As the user selects a different fruit from the dropdown, the corresponding bar changes color to highlight it.
The app is deployed on a local Python server with app.run(debug=True) when the script is run directly.
To maintain the original order of fruits in the plot, you need to explicitly set the category_orders property in the Plotly Express bar plot. Otherwise, the px.bar automatically sorts the data based on the color variable.
Graph properties
Graph properties in Dash and Plotly are essential for customizing and controlling the appearance and behavior of your visualizations. The dcc.Graph component allows you to embed Plotly graphs as value of its figure property, which can be dynamically updated based on user interactions. Key properties of dcc.Graph include id, figure, config, style and className.
Similarly, Plotly graphs created with Plotly Express (px.) or Plotly Graph Objects (go.) offer numerous properties such as data_frame, x, y, color, size, title, labels and template. These properties help tailor your graphs to fit specific needs and enhance interactivity and user experience.
| dcc.Graph | description |
|---|---|
id |
Unique identifier for the component. |
figure |
The figure property holds the Plotly figure (a dictionary). |
config |
Dictionary to configure the appearance and behavior of the graph (e.g., displayModeBar, responsive). |
style |
CSS styling for the graph component. |
className |
CSS class name for applying styles. |
Both methods: Plotly Express and Plotly Graph Objects can create similar visualizations, but Plotly Express is more concise and user-friendly for quick plots, while Plotly Graph Objects offer more detailed customization and flexibility.
| Plotly Express (px) | description |
|---|---|
data_frame |
Data frame or array to visualize. |
x |
Column name for x-axis. |
y |
Column name for y-axis. |
color |
Column name for color coding. |
size |
Column name for sizing markers (e.g., scatter plots). |
title |
Title of the graph. |
labels |
Dictionary for axis labels. |
template |
Layout template for the graph (e.g., ‘plotly_dark’). |
PX properties are designed for quick and easy creation of standard plots with minimal code.
import plotly.express as px

df = px.data.tips()
fig = px.bar(df, x='day', y='total_bill', color='sex', title='Total Bill per Day')
| Plotly Graph Objects (go) | description |
|---|---|
data |
List of traces (e.g., go.Bar, go.Scatter). |
layout |
Dictionary for layout settings (e.g., title, xaxis, yaxis). |
title |
Title of the graph. |
xaxis |
Dictionary for x-axis settings (e.g., title, range). |
yaxis |
Dictionary for y-axis settings (e.g., title, range). |
GO properties provide more control and customization for complex plots with detailed specifications.
import plotly.graph_objects as go

fig = go.Figure(data=[go.Bar(x=['A', 'B', 'C'], y=[1, 3, 2])])
fig.update_layout(title='Sample Bar Chart', xaxis_title='Category', yaxis_title='Value')
You cannot directly use properties like title, xaxis_title and yaxis_title within go.Bar. Instead, you set these properties using the update_layout() method.
In Plotly, go.Bar needs to be embedded within a go.Figure to define the overall layout and combine multiple traces. Combining traces and layouts in go.Figure enables the creation of complex, interactive visualizations. This structure allows for comprehensive customization and management of graph elements.
import plotly.graph_objects as go

# Create a bar chart using go.Bar
trace = go.Bar(x=['A', 'B', 'C'], y=[1, 3, 2])

# Embed the trace in go.Figure
fig = go.Figure(data=[trace])

# Update the layout for titles
fig.update_layout(
    title='Sample Bar Chart',
    xaxis_title='Category',
    yaxis_title='Value'
)

# Display the figure
fig.show()
Dash Dependencies: Input, Output, State
Dash dependencies, such as Input, Output and State, are essential for creating interactivity within your Dash applications. They allow components to respond dynamically to user input and other component states.
Input captures user inputs.
Output defines which component properties to update.
State allows access to the current state of a component without triggering a callback.
| dependency | description | example instance | explanation |
|---|---|---|---|
Inputs |
captures user input from components like dropdowns, sliders, etc. | Input('dropdown', 'value') |
Monitors the selected value of the dropdown. |
Output |
specifies which property of a component will be updated by the callback | Output('graph', 'figure') |
Updates the figure property of the graph. |
State |
retrieves the current state of a component without triggering the callback | State('input-box', 'value') |
Reads the value of the input box without triggering a callback. |
The syntax for Input, Output and State is similar and specifies the component id and the property to monitor or update.
component_id- theidattribute of the Dash componentproperty- the property of the component to monitor forInputor update forOutput
# Syntax for Input
Input(component_id, property)

# Syntax for Output
Output(component_id, property)
For a comprehensive list of available properties and methods for Dash dependencies, check the official Dash documentation under the Callbacks section.
Dash dependencies enable dynamic interactivity within your app. For instance, Input can trigger changes, Output specifies the target component for updates and State can maintain component values without causing callbacks.
Be mindful that components using State will not trigger a callback on their own. They only provide their current state to the callback function when it is triggered by an Input.
Callbacks
Inputs, Outputs and States components are used exclusively within callbacks in Dash applications. They define the interactivity by specifying which component properties trigger the callbacks (Inputs) and which properties are updated by the callbacks (Outputs). This structure allows for dynamic updates and interactivity in your Dash app.
Callbacks in Dash are Python functions that are automatically called when a specified input changes, allowing components in the app to interact dynamically. By using callbacks, you can achieve real-time updates, such as updating graphs, changing displayed text or manipulating any component properties based on user input. This interactivity makes Dash applications highly responsive and capable of handling complex user interactions.
The minimal example: callback with Inputs and Outputs
@app.callback(
    Output('output-div', 'children'),
    Input('input-box', 'value')
)
def update_output(value):
    return f'You entered: {value}'
In this example, the callback function update_output is triggered by changes to the input-box value (Input) and updates the output-div content (i.e. Output children property).
Input('input-box', 'value'): Monitors thevalueproperty of the component withidinput-box.Output('output-div', 'children'): Updates thechildrenproperty of the component withidoutput-div.
These specifications ensure the callback function is triggered by the specified Input and updates the specified Output.
This callback function assumes that the Input and Output components with the same id attributes are already created in the app’s layout. Ensure that the components specified in the Input and Output decorators exist within the app.layout to avoid errors. For example, input-box and output-div must be defined as id of some components within the layout for the callback to function correctly.
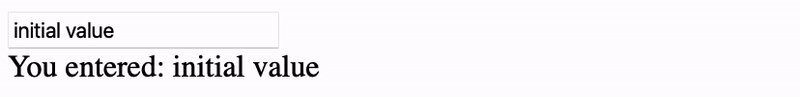
Here is the minimal app that uses this callback:
from dash import Dash, dcc, html, Input, Output

# Create Dash app instance
app = Dash(__name__)

# Define app layout
app.layout = html.Div([
    dcc.Input(id='input-box', type='text', value='initial value'),
    html.Div(id='output-div')
])

# Define callback function
@app.callback(
    Output('output-div', 'children'),
    Input('input-box', 'value')
)
def update_output(value):
    return f'You entered: {value}'

# Deploy app on the local Python server
if __name__ == '__main__':
    app.run(debug=True)
What the script does?
This minimal Dash app includes an input box (dcc.Input) and a div element (html.div), examples of Dash core components and HTML components, respectively. The callback function updates the div’s content to display the text entered in the input box. This example demonstrates the basic use of Input and Output to create interactivity within the app.
Note that the app.layout comes first, defining all static components of the application. This is where you set up the structure and initial state of your app, defining all components with their id attribute and other properties. Following the layout, the callbacks section is defined. This section includes functions that handle the interactivity of the app by updating component properties based on user inputs/actions.
The separation of the layout and callbacks in the app’s code ensures a clear structure and organization of the app.
Further Reading
Plotly graphing - interactive examples in the JupyterLabCreating XY scatter plot
Creating 1D volcano plot
Creating heatmap
Creating dendrogram
Creating clustergram
RStudio – data processing & plotting with R
Creating boxplots in R
Creating heatmaps in R
Creating heatmaps in R using ComplexHeatmap
MODULE 09: Project Management