
Introduction
Python is a popular programming language that is widely used for data analysis and scientific computing. One of the key features of Python is the ability to create interactive graphs using libraries such as Plotly and Dash. These libraries can be used to create interactive graphs and web applications for data visualization.
The Plotly library is built on top of Plotly.js, and allows users to create a range of interactive graphs. Dash is a web app framework that allows users to build interactive web apps using Python and Dash HTML Components.
Using Plotly and Dash together, users can create engaging, informative, and highly interactive graphs and web applications that can be used to explore and analyze data on-the-fly. This can be useful for data scientists, researchers, and analysts who want to share their findings with others in a visually appealing and intuitive way.
Plotly-Dash Graphing Library
Plotly is a modern and extensively developing library for interactive graphing. It is an open-source project that provides compatibility with the most popular programming languages, such as Python, R, Julia, Javascript, F#, ggplot2, and MATLAB. All variants have detailed documentation and separate GitHub repositories with issues tracking and opportunity for contribution.
The Plotly library allows users to create a wide range of interactive graphs, including scatter plots, bar charts, heatmaps, and customized arrangements of them. The library is built on the JavaScript plotting library, Plotly.js, and is highly customizable, allowing users to specify the appearance and behavior of their graphs.
The Plotly team developed also an open-source analytical web app framework → Dash, which allows users to build interactive web applications for data visualization. Dash apps are built using Python engine, and the app’s user interface is defined using various Dash Components: core, HTML and bootstrap. So, you can effortlessly add many different widgets such as dropdowns, buttons, sliders, and dialog boxes to support application management and user-triggered on-the-fly chart customization.
That is a total game-changer in developing interactive web applications and data visualization!
Types of Plotly charts
The Plotly library offers many types of interactive charts. The image below shows just a few examples from a vast set that is constantly growing.
So if you’ve been inspired, you’ll learn more about the Plotly library and get hands-on experience using it in the Python coding variant by exploring the following tutorial: .
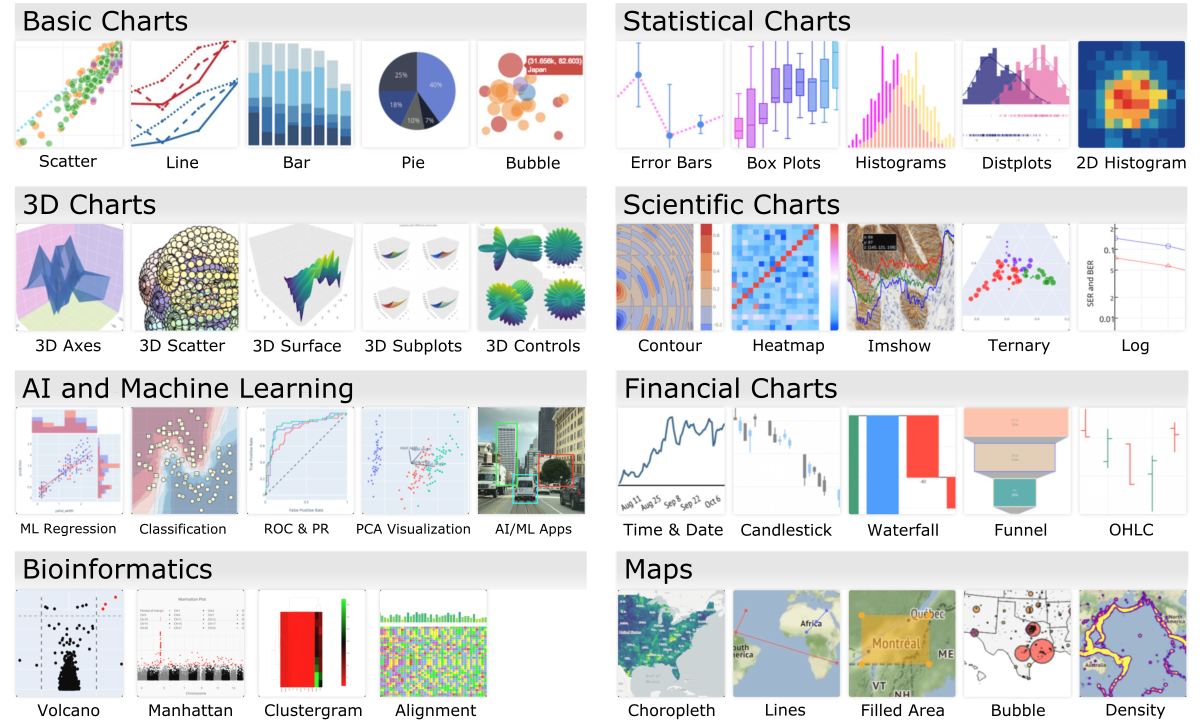 Figure 1. The categorized examples of Plotly interactive graphs.
Types of Dash widgets
The Dash library offers many templates for components that facilitate building an interactive web application and user-triggered changes in the Plotly graphs. Both libraries are fully compatible. Dash’s main modules include core components that allow loading inputs and change chart parameters. There are also HTML and Bootstrap components that simplify the creation of the page layout and facilitate the implementation of navigation events.
…details in the hands-on tutorial on .
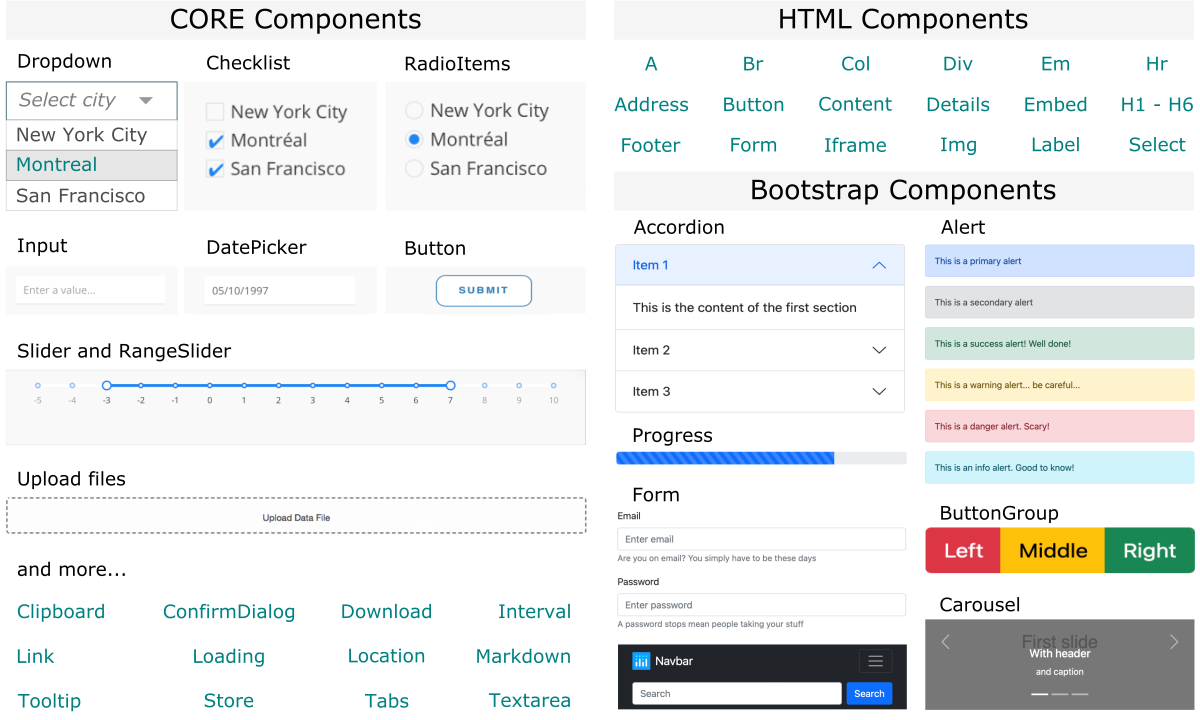 Figure 2. Examples of Dash widgets for interactive web applications, including Core, HTM and Bootstrap components.
How to get started?
Creating interactive graphs with Plotly-Dash can be done in various computing & visualization environments, each catering to different levels of expertise and requirements. In the following subsections, you will find a guide from the simplest to the most advanced options.
Python-Plotly based approach is ideal for interactive graphing, enabling on-the-fly data analysis and graph adjustments. If you require only static plots for your data, simpler solutions are available. Consider using the Gnuplot CLI tool or the Matplotlib library for Python-based scripting, which are more suited for generating static visualizations.
Jupyter Notebook
beginner
Jupyter Notebooks are an excellent starting point for beginners. They allow you to create and display interactive Plotly graphs inline with your code and graphical outputs, making it easy to experiment and visualize data on the fly.
- Jupyter Notebook - development environment, see installation guide
- Python - programming laguage, see installation guide
- Plotly - Python graphing library, see installation guide
You can set up the requirements on your local machine or utilize an HPC system that provides in-browser access through the Open OnDemand service.
If you follow the tutorials listed in the Further Reading section, you can gain hands-on experience and access ready-made plotting examples using the Jupyter Lab approach. These tutorials cover creating various types of graphs, including scatter plots, volcano plots, heat maps, dendrograms, and clustergrams.
Python Script via local server in CLI with in-browser GUI
intermediate
For a more dynamic and interactive experience, you can create a Dash application that runs a local server. This allows you to build sophisticated dashboards and interactive web applications that can be accessed via a web browser.
- Python - programming laguage, see installation guide
- Plotly - Python graphing library, see installation guide
- Dash - Python web development library, see installation guide
You will also need to set up a Python environment on your local machine and have a basic understanding of running Python scripts from the command line.
Python Script executed in CLI with outputs exported to a file
intermediate
For those who need to generate plots and share them without an interactive environment, generating static files like HTML, PDF or PNG from the CLI is an efficient option. This method allows you to script the generation of plots and save them for presentation or reporting purposes.
- Python - see installation guide
- Plotly - Python graphing library, see installation guide
- additional libraries for exporting (e.g.,
kaleidofor PNG, PDF)
You will also need to set up a Python environment on your local or remote machine and have a more advanced understanding of creating Python scripts and working with the command line.
Web Application Development
advanced
Experienced developers can integrate Plotly-Dash into full-fledged web applications. This approach leverages the power of web frameworks like Flask or Django to embed interactive Plotly graphs within complex web applications, offering a robust and scalable solution for data visualization.
- Python - programming laguage, see installation guide
- Plotly - Python graphing library, see installation guide
- Dash - Python web development library, see installation guide
- Flask or django - web framework libraries
You will also need knowledge and a good understanding of web development and deploying web applications.
Example web applications that use Plotly-Dash on the backend to provide an interactive GUI include the Mapiya contact map analyzer for biomolecules and the BIAPSS physicochemical analyzer for LLPS protein sequences. These applications showcase the power of Plotly-Dash in creating interactive and user-friendly interfaces for complex data analysis.
Further Reading
Introduction to Plotly (python)Introduction to Dash (python)
Plotly graphing - interactive examples in the JupyterLab
Creating XY scatter plot
Creating 1D volcano plot
Creating heatmap
Creating dendrogram
Creating clustergram
RStudio – data processing & plotting with R
Creating boxplots in R
Creating heatmaps in R
Creating heatmaps in R using ComplexHeatmap
MODULE 09: Project Management