
DataScience Workbook / 09. Project Management / 4. Quality Assurance / 4.1 Monitoring & Evaluation
Introduction
In this tutorial, let’s dive into the world of Monitoring & Evaluation (M&E) and unpack why it’s such a game-changer for your research projects. M&E isn’t just fancy jargon; it’s a critical toolkit that helps you keep your project on track, ensuring that you’re not just doing work, but you’re doing the right work. It’s all about making sure that your project hits its marks, delivers on its promises and, most importantly, contributes to knowledge and practice in meaningful ways. By integrating M&E from the get-go, you’re setting up your project for success and ensuring that every effort counts towards making a tangible impact.
With a little creativity and strategic thinking, Monitoring and Evaluation techniques can reinforce your research and help you make informed decisions every step of the way.
Let’s explore how you can apply M&E principles effectively, ensuring your project is not just a drop in the ocean but a wave of change in your field.
Scope and Significance
In small to moderate size research projects, M&E plays a crucial role by providing a structured approach to manage and evaluate the project from inception to conclusion. Its application helps in steering the project towards its defined goals, ensuring resources are used effectively and outcomes are achieved as planned.
Monitoring & Evaluation (M&E) is a systematic framework designed to assess the progress and effectiveness of a research project's activities, ensuring objectives are efficiently met.
M&E activities are structured around four pivotal components: Planning, Monitoring, Evaluation and Adaptation. Each serves a unique purpose:
-
Planning charting the course for quality oversight.
This involves outlining specific aspects of the project that will be monitored to ensure standards are met throughout and guarantee the quality of data, methods, and results. -
Monitoring keeping tabs on your progress.
Continuously tracking progress against the project plan to ensure activities align with the objectives. It helps in identifying any deviations early on. -
Evaluation gauging success at key milestones.
Assessing the project’s outcomes against the initial benchmarks and objectives to determine its success and areas for improvement. -
Adaptation fine-tuning for excellence.
Implementing changes based on evaluation insights to refine and improve project processes and outcomes. This step involves adjusting strategies, methods, or practices in response to identified challenges and opportunities for enhancement.
Consider a moderate-scale agricultural study aimed at improving tomato plant yield using two different organic fertilizers.
EXAMPLE 2:
Consider a small-scale bioinformatics project focused on identifying genetic markers associated with resistance to a specific antibiotic in bacteria.
| Project | Planning | Monitoring | Evaluation | Adaptation |
|---|---|---|---|---|
| Bioinformatics project on antibiotic resistance | Goal to identify resistance markers via sequence analysis. Key metrics: identification accuracy and computational efficiency. | Weekly genome analysis to track resistance marker identification against benchmarks. | Noticed overlooked resistance markers and slower computational processes than expected. | Refined data algorithms to include more genetic variations and optimized computational methods for speed. |
Best Practices
Boosting the quality of research requires a balanced approach that merges quantitative assessments of specific targets in your project, such as measuring data accuracy or computational efficiency, with qualitative actions and a strong commitment to best practices. This holistic approach ensures that while statistics on data provides objective insights into progress and performance, some good habits enrich the research’s depth, integrity, and relevance.
Best practices in M&E emphasize a structured, transparent, and participatory approach to research, ensuring that projects are not only accountable and effective but also adaptable and impactful based on solid evidence and academic community engagement.
Here are additional activities under Monitoring and Evaluation that can help ensure quality assurance.
MONITORING
| 1. Effective Use of Tools | Select tools that match the project’s requirements. Proper tools simplify tracking progress and analyzing data, making the M&E process more manageable. Tools should enhance, not complicate the process. |
|---|
EXAMPLE:
| 2. Project Progress Checks | Conduct regular team meetings to review progress, discuss any issues encountered and ensure that data collection & processing tasks follow the predefined protocols. This communication helps identify and solve issues quickly, ensuring the project stays on course. |
|---|
EXAMPLE:
| 3. Efficient Use of Resources | Monitor resource allocation, resource usage and work hours spent on each project activity. Keeping a record helps in assessing whether resources are being used efficiently and aids in planning for future needs. |
|---|
EXAMPLE:
| 4. Culture of Accountability | Assign specific team members the responsibility of performing the accuracy measurements and validating data at each step. This step helps catch mistakes and improves the overall quality of data and methods. |
|---|
EXAMPLE:
| 5. Transparency in Mid-Project Reporting | Ensure all aspects of your research, including methodologies, data collection, and findings, are regularly documented and accessible. This fosters trust, supports decision-making and facilitates peer review. It also prepares the ground for future project replication. |
|---|
EXAMPLE:
EVALUATION
| 1. Data-Driven Decision Making | Base decisions on analyzed data rather than assumptions. Making informed decisions ensures project adjustments are grounded in real evidence. |
|---|
EXAMPLE:
| 2. Inclusive Approaches | Engage project team and collaborators in the evaluation process to ensure their experiences shape project adaptation. Keep collaborators informed about progress and challenges. This approach enhances project transparency. |
|---|
EXAMPLE:
| 3. Qualitative Feedback from the Team | Collect and consider the team's qualitative feedback alongside quantitative data. This feedback ensures diverse perspectives and provides deeper insights into the project's areas for improvement. |
|---|
EXAMPLE:
| 4. Double-Check and Cross-Validation Mechanisms | Verify the accuracy of data and tasks by having them reviewed by another team member. The double-check ensures the reliability and accuracy of evaluation results, safeguarding the project's integrity. The peer-review practice ensures high standards are maintained and errors are minimized. |
|---|
EXAMPLE:
| 5. Continuous Improvement | Use findings from the evaluation to iteratively enhance project methods and outcomes. Feedback loops are crucial for integrating new insights and lessons learned into current and future projects. |
|---|
EXAMPLE:
EXCERCISE
Choose any current or upcoming project you're involved in. Based on the best practice recommendations provided, draft a brief outline of the Monitoring & Evaluation (M&E) actions you plan to implement. Include specific tools, methods, and frequency of evaluations.
TIP: Ensure your plan addresses each of the key M&E components: Planning, Monitoring, and Evaluation.
Additional Questions to Guide Your Task:
If you're currently without a project idea, try answering those questions for a hypothetical photogrammetry project focused on surveying corn crops in a region prone to weather hazards, to gain practical insights into planning M&E actions.
Tools and Methods
When it comes to choosing these tools and methods, several key criteria must be considered to ensure they align well with your project’s needs. Cost is often a primary concern for smaller projects, making affordable or free tools particularly attractive. Ease of use is crucial as well, as it impacts the learning curve and the speed at which your team can become productive. Scalability ensures that the tool can grow with your project, accommodating more data or users as needed. Lastly, the relevance of the tool to your specific project needs is essential to ensure it adds value rather than complexity to your processes.
| Cost | Tools should be affordable, with free options or plans that match the project budget. |
| Ease of Use | The learning curve should be minimal, allowing for quick adoption by all team members. |
| Scalability | The tool should accommodate the project's growth, handling more data or users as required. |
| Relevance | It must meet the specific needs of the project, whether for data collection, analysis, or reporting. |
Understanding and applying these criteria will help you navigate the wide array of available M&E tools and methods, ensuring you select those that will most effectively support your project's unique requirements.
Manual Methods
It’s smart to recognize the significance and utility of manual methods and low-tech solutions, especially in scenarios where digital tools may not be feasible or necessary. This can be particularly relevant for small-scale research projects where resources are limited, the datasets are easily manageable or in environments with limited access to technology.
| Physical Progress Tracking Boards Utilize whiteboards or cork boards to monitor quality assurance milestones and evaluation checkpoints. This visual tool allows teams to mark critical stages in the project's lifecycle, from initial quality benchmarks to subsequent evaluations, facilitating a clear view of progress and areas needing attention. |
|
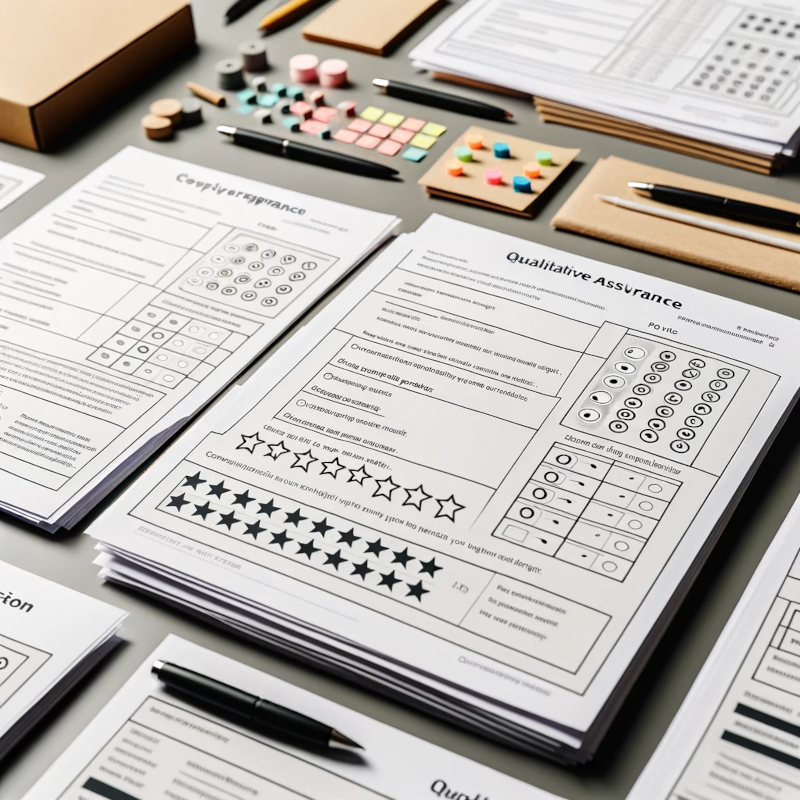 |
Paper-based Evaluation Forms Design paper forms specifically for evaluation purposes, allowing evaluators to assess project components against predefined quality criteria. These forms can be structured to capture both quantitative data (e.g., ratings on a scale) and qualitative feedback (e.g., open-ended responses), offering a comprehensive view of project performance. |
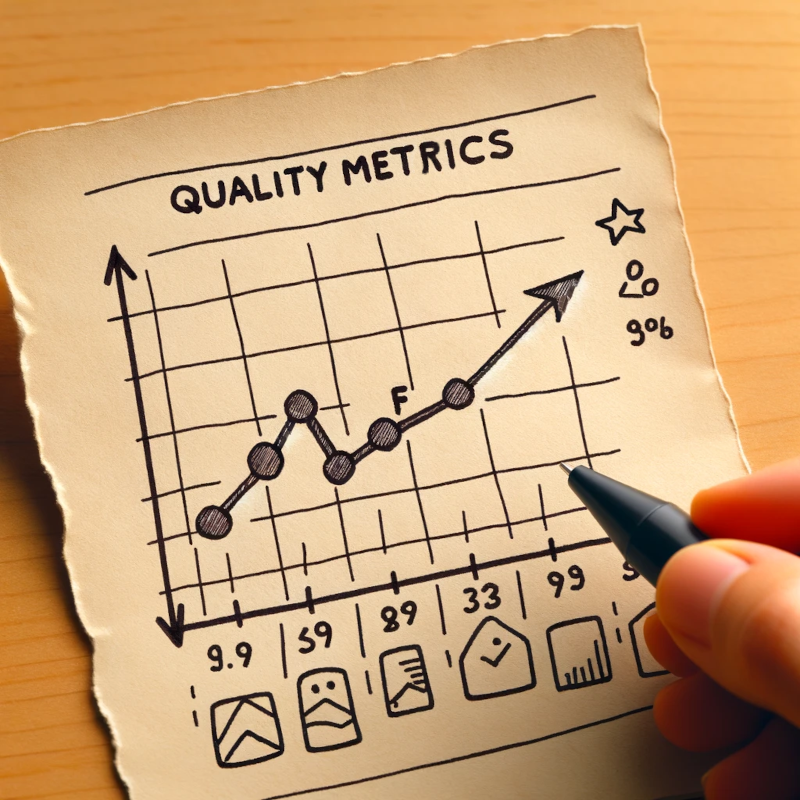 |
Hand-drawn Charts for Quality Trends Manually create charts to visualize trends in quality metrics over time. Drawing these charts can help project teams and collaborators to visually grasp improvements or declines in project quality, enabling targeted discussions on maintaining or enhancing standards. |
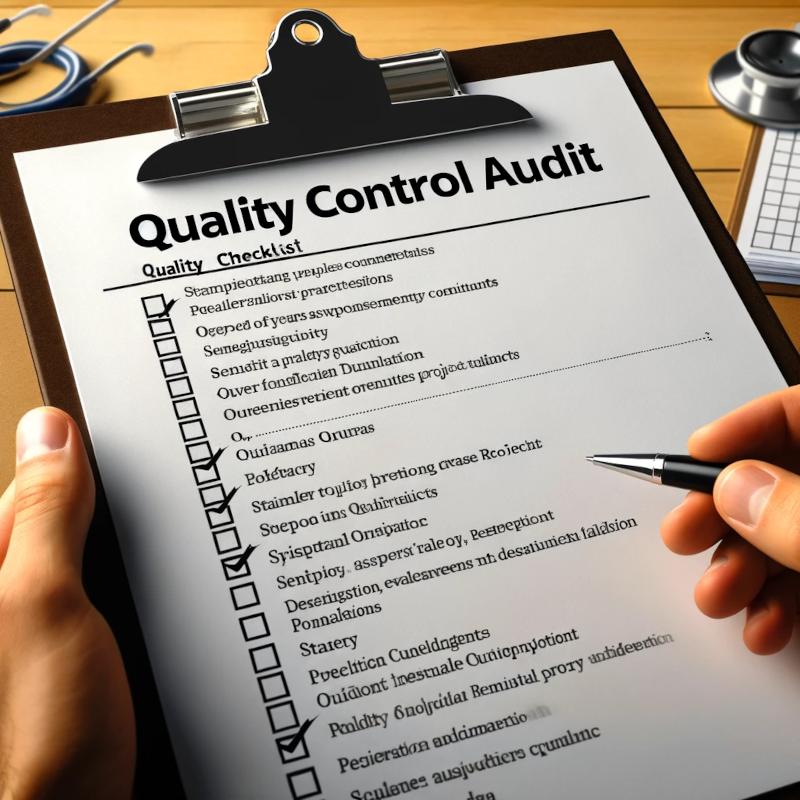 |
Checklists for Quality Control Audits Develop detailed checklists tailored to the project’s Quality Assurance standards, to be used during periodic audits or reviews. These checklists ensure that every aspect of the project is evaluated consistently, helping to identify deviations from quality benchmarks and necessary corrective actions. |
Digital Tools
Digital tools for Monitoring & Evaluation in Quality Assurance have become indispensable in the contemporary research. These tools not only streamline the M&E process but also enhance the accuracy and reliability of your research, offering insights that drive informed decision-making. Below is a selection of digital tools that are particularly useful for M&E tasks in research projects, with a focus on their applicability and ease of use.
Tools for Evaluating Data and Methods
| tool category | tool | easy-to-use level | interface | description |
|---|---|---|---|---|
| Data Validation and Cleaning | OpenRefine | Medium | desktop app | A powerful tool for working with messy data, cleaning it, transforming it from one format into another, and extending it with web services. |
| Statistical Analysis | JASP | High | desktop app | Facilitates both frequentist and Bayesian analysis, valuable for validating research methods and results. |
| Statistics and Text Mining | Orange | High | desktop app | A data mining, machine learning, and data visualization tool that features a visual programming front-end for explorative data analysis and interactive data visualization. |
| Version Control | Git with GitHub | Medium | online GUI/CLI | Essential for tracking changes in methodologies and data scripts, enhancing methodological transparency and reproducibility. |
| Validation and Reporting | Jupyter Notebooks | High | UI in web browser | An open-source web application that allows you to create and share documents that contain live code, equations, visualizations, and narrative text for transparent reporting. |
While digital tools can significantly aid in detecting errors, filling in missing values, and resolving inconsistent formatting, it's crucial to understand that no single tool can automatically "fix" your data or provide a one-stop solution for a "beautified" data collection. The landscape of digital tools is vast, and selecting the right one requires careful consideration of your specific project needs and challenges.
Tools for Effective Monitoring and Adaptability in Projects
| tool category | tool | easy-to-use level | interface | description |
|---|---|---|---|---|
| Decision Support | KNIME | Medium | desktop app | Provides a data analytics platform that supports the integration of various data sources and analysis methods for informed decision-making. |
| Continuous Improvement & Feedback | SurveyMonkey | High | online GUI | A tool for creating surveys to collect feedback for continuous project improvements. Offers analytics to make data-driven decisions. |
| Tasks Management | Trello | High | online GUI | Useful for adapting project plans and tasks based on new decisions, with a visual interface for tracking changes and updates. |
| Collaborative Communication | Slack | High | desktop app | Facilitates real-time communication and decision-making among project team members, ensuring adaptability and responsiveness to project needs. |
| Survey and Feedback | Google Forms | Medium | online GUI | A user-friendly tool for creating surveys, forms, and collecting documents in an organized manner. |