
DataScience Workbook / 07. Data Acquisition and Wrangling / 2. Data Manipulation
Introduction
Data manipulation refers to the process of transforming and organizing data to make it more useful for analysis, reporting, meeting specific research requirements. It is a crucial step in data analysis, as it enables researchers to extract valuable insights from raw data.
This process often involves cleaning, merging, restructuring, or summarizing data, among other tasks.
There are many tools and techniques available to help researchers effectively manipulate and analyze their data. Whether working with Excel, Python, R, SQL, or other specialized tools, researchers should carefully consider their data manipulation needs and choose the tools and techniques that best suit the research goals.
Try out any of the tools quickly online!
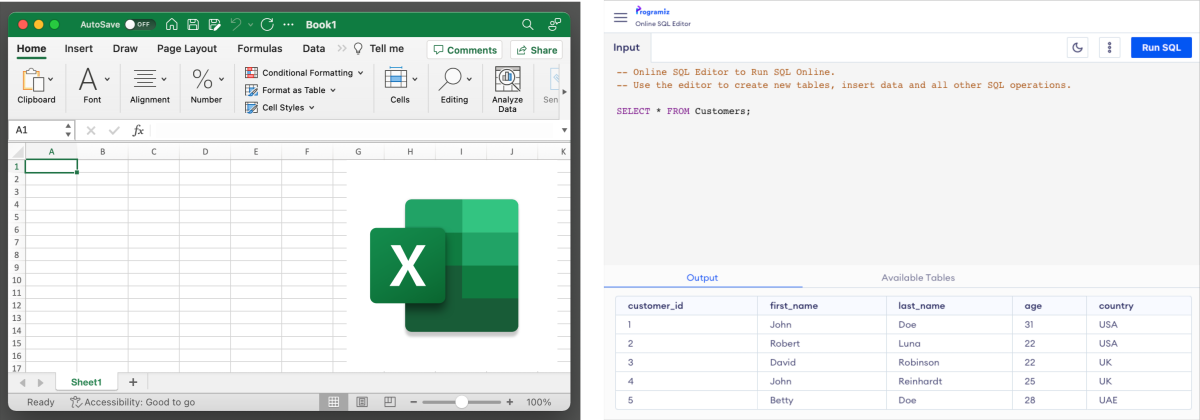
EXCEL
Google Sheets online ⤴
Microsoft Excel GUI
SQL
www.programiz.com/sql ⤴
SQL programming language
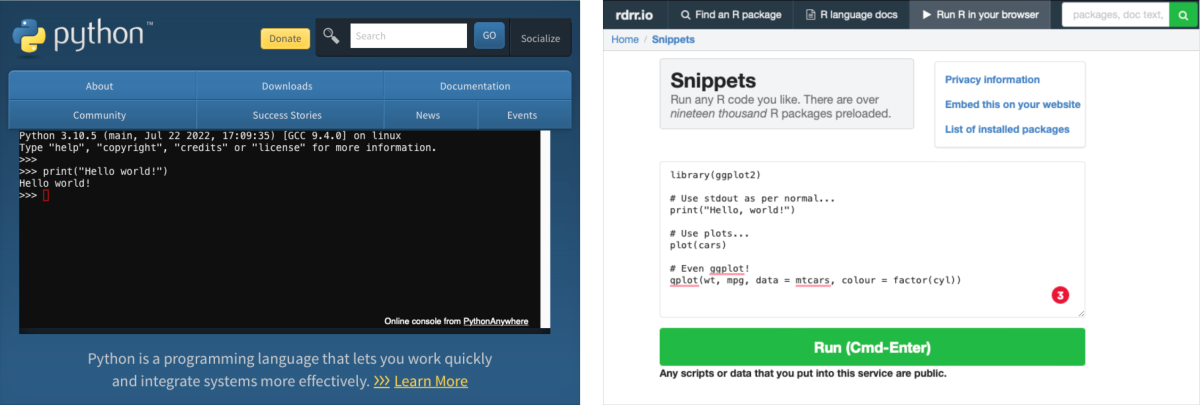
PYTHON
www.python.org/shell/ ⤴
Python programming language
R
https://rdrr.io/snippets/ ⤴
R programming language
Excel
One of the most common tools with a graphical user interface (GUI) used for data manipulation and analysis is Microsoft Excel ⤴. Excel offers a wide range of built-in features for organizing and analyzing data, including:
- sorting,
- filtering,
- merging and splitting data, and
- calculating functions.
By using these features, researchers can quickly and easily manipulate data sheets to create summaries, charts, and reports.
To learn more about manipulating Excel data sheets, you can visit the following website: Basic tasks in Excel ⤴ by Microsoft.
Explore practical examples in the hands-on tutorials available in this workbook:
- INTRODUCTION: Manipulating Excel Data Sheets ⤴
- TUTORIALS:
Python
Python ⤴ is a powerful programming language widely used for advanced data analysis, statistics, and interactive visualization, particularly for working with large text files. Python offers a rich set of libraries and modules that can be used to manipulate text files, including:
- Pandas, a Python library for efficient data structure manipulation and analysis
- NumPy, a Python library for computing and data structure transformation
- SciPy, a Python library for scientific computing and statistics
- Math, a Python module for mathematical operations
- Regex, a Python module for working with regular expressions
- JSON, a Python module for working with data in JSON format
With these libraries, you can manipulate large text files, clean and transform data, perform statistical analysis, and format the the output.
To learn more about manipulating large text files with Python, you can visit the following tutorials in this workbook:
- INTRODUCTION:
- TUTORIALS:
R
R ⤴ is another popular programming language used for statistical analysis and simple data visualization. It provides several libraries and functions for data manipulation, including:
- dplyr ⤴, an R package for data filtering, selecting, arranging, and summarizing
- tidyr ⤴, an R package for data cleaning, reshaping and tidying
- reshape2 ⤴, an R package for data manipulation and reshaping
With these libraries, you can manipulate and transform data, filter, select, and summarize data.
To learn more about manipulating data for a quick statistical analysis with R, you can visit the following tutorials in this workbook:
- INTRODUCTION:
- TUTORIALS:
SQL
SQL ⤴ (Structured Query Language) is a powerful language used for managing and manipulating relational databases. It provides several functions and commands for data manipulation, including SELECT, INSERT, UPDATE, and DELETE. With SQL, you can manipulate data stored in a database, extract data, and perform statistical analysis.
To learn more about SQL, you can visit the website https://www.w3schools.com/sql/default.asp
Other tools for data manipulation in research projects
In addition to the above tools and languages, there are several other specialized software for data manipulation in research projects, including:
| software | description |
|---|---|
| MATLAB ⤴ | programming language and environment for numerical computing and data analysis |
| SAS ⤴ | statistical software suite for data management, analysis, and visualization |
| OpenRefine ⤴ | tool for cleaning and transforming messy data |
| Tableau ⤴ | tool for data visualization and manipulation |