
DataScience Workbook / 04. Development Environment / 3. R programming environment(s) / 3.1 RStudio: Integrated Environment for R Programming
Introduction
Why Use RStudio?
RStudio is a popular IDE for R that provides a convenient and user-friendly interface for working with the language. It includes a console, code editor, and tools for managing and organizing projects. RStudio also integrates with other software and tools, such as Git and Shiny, and includes additional features like a debugger and package manager.
Some of the benefits of coding R using RStudio instead of a terminal are:
- Ease of use: it helps with writing, formatting, and debugging code
- Version control: Git is integrated with RStudio
- Visualization: Plots window in RStudio allows viewing and interacting with plots and other graphics generated by your code
Using RStudio
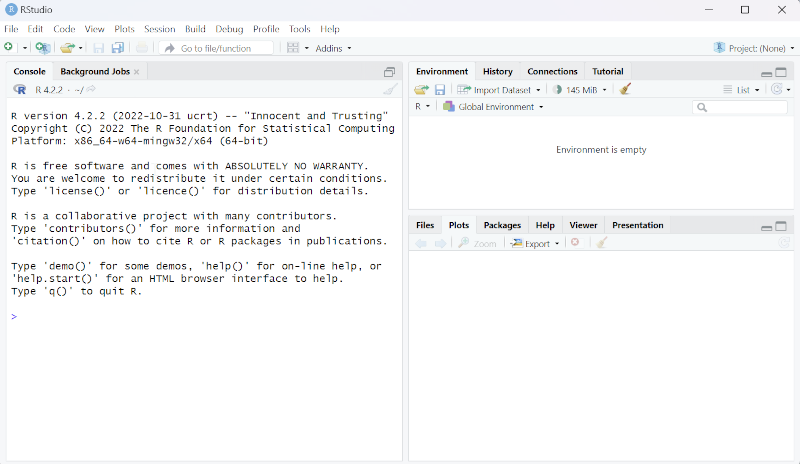
Once you have set up RStudio ⤴ , you can open RStudio from start menu on your computer. When you first open RStudio, you will see a console window on the left and depending on your system, a few other windows on the right like environment, files or plots pane, etc.
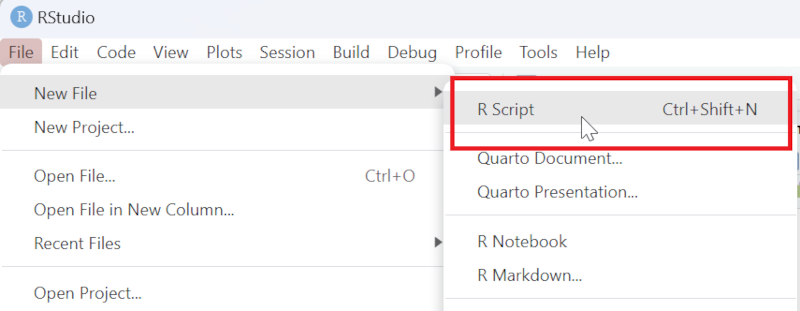
New R Script
If you do not see an empty editor window, you can open a new R Script file from the File menu:
An empty R Script file will open:
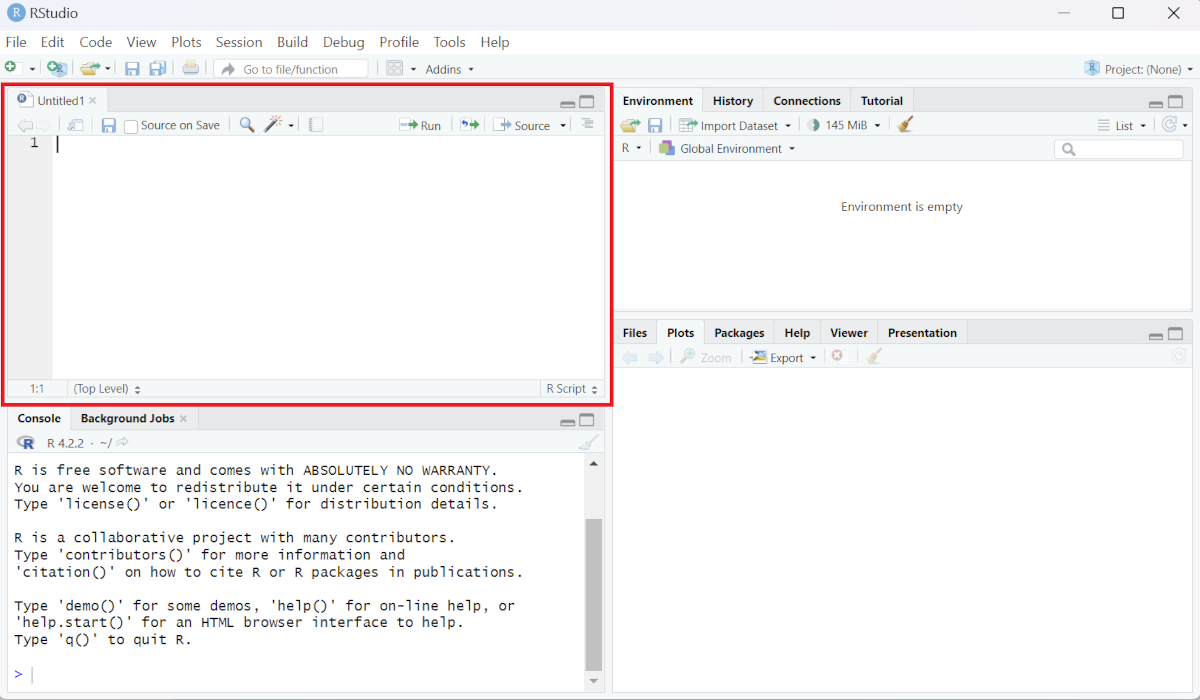
This is the code editor and you can write your code in this space. You can directly write code in the Console as well but editor allows you to run parts of code, save progress, make comments etc. Try writing the following code, and then run by selecting the lines you want to run and clicking the Run button:
install.packages("ggplot2")
library(ggplot2)
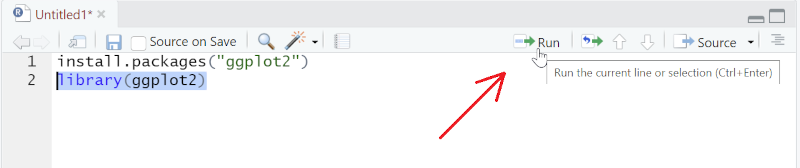
If you select only the second line as shown and run, it will load the library ggplot2 if it is installed on your system. If you have not installed the package, you will need to run the first line of code first. After the libarary is loaded, you can run the rest of the code shown below to create a plot using ggplot2. The following code uses sample dataset called mpg already included within the ggplot2 library.
# this is a comment
# An example
ggplot(mpg, aes(displ, hwy, colour = class)) +
  geom_point()
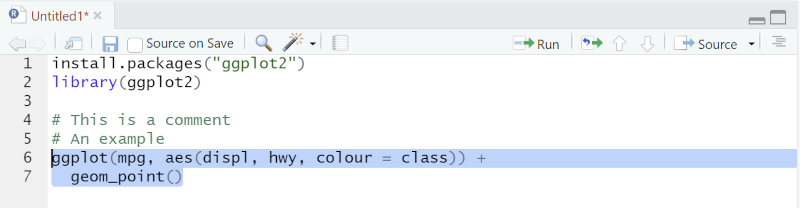
The editor will create an indent in the second line when you write this code. When you select both the lines and run it successfully, the following plot will appear on the Plots window:
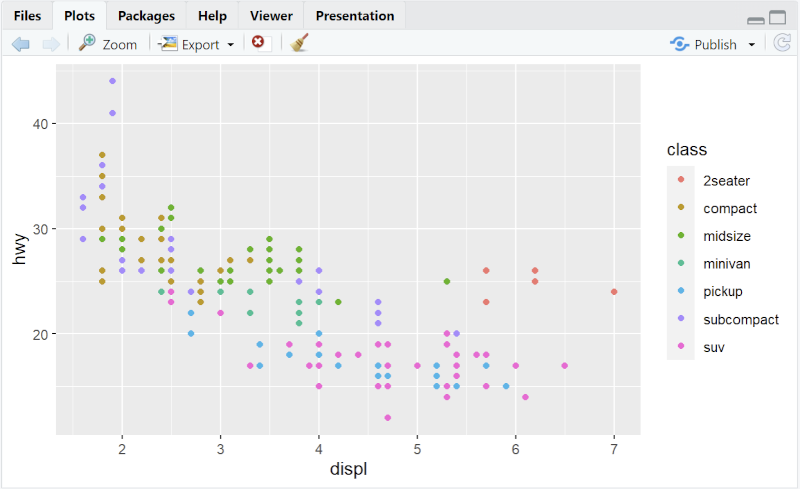
That’s how simple it can be to make a plot using RStudio!
To save your work, you can use Ctrl+S keyboard shortcut or Save option in File menu.
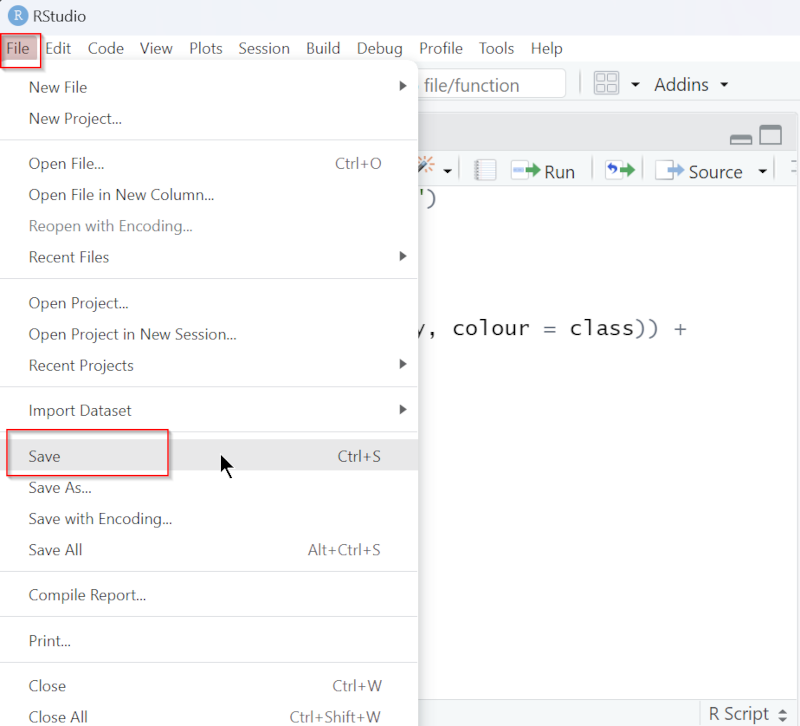
Other options within the File menu include:
New Project: creates a new directory/folder for your projectOpen File: to open a previously saved fileOpen Project: similar to opening a directory/folder containing all files related to a projectSave All: to save all the open files
Additional Useful options
Importing data
Data from a file can be imported into your RScript. There are several ways and exact method will depend on the format of your data. Let’s say you have your data in a csv file (text file with comma separated values) that you want to use in your R Script. You can use the read.csv() method to read the file. This command takes a few arguments as input:
path: The path to the file containing your dataheader: Optional, to indicate if you want to import column headings. (TRUE by default)sep: The separator for the values in each row of your data
It is a good practice to define the path first separately and then use the desired method to read files as the path can then be reused in other commands.
path <- "path/to/your/data"
data <- read.csv(path, header = TRUE, sep = “,”)
Once data is imported and stored in the variable “data”, it can then be accessed and used.
print(data)
Environment panel
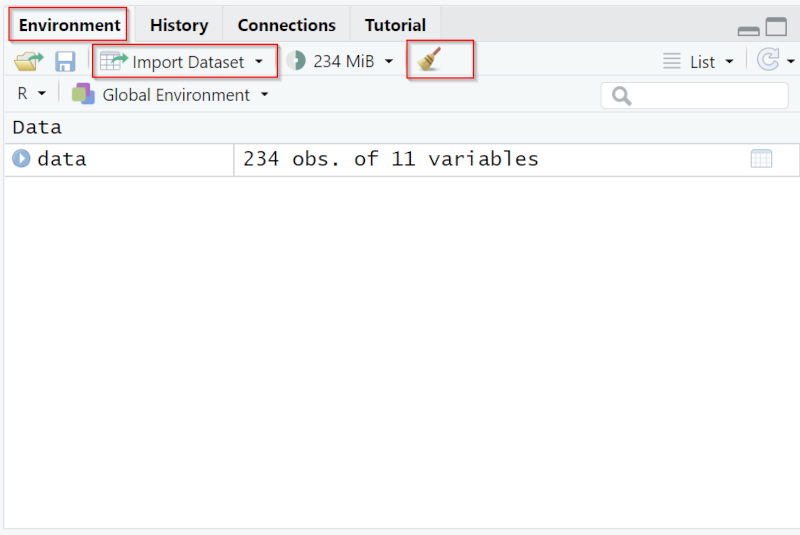
Usually on top right, the environment panel contains list of any loaded data, values, and functions. As you can see below, the liat will have object/dataset name “data” in this case, and what is within that object “234 obs. of 11 variables” in this example. Clicking on the dataset will open it. You can also import data using Import Dataset option in this panel.
The whole list of loaded environment variables/data (objects) can be cleared using the broom button. It will wipe all variables from memory of the session and variables will need to be loaded again to use.
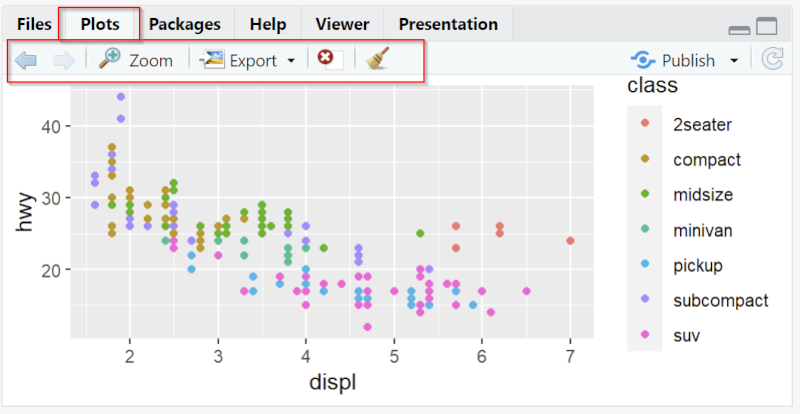
Plots panel
The plots tab on the panel on lower right shows the plots generated. There are a few options highlighted below, including the arrows to go through different plots generated during this session, Export option to export and save the plot, and the broom to clear all plots from memory.
Some other useful tabs within this panel are:
Files: lists files in current working directoryPackages: lists all available packages in the user library and system libraryHelp: Documentation for different packages. Can be used to search for specific packages and instructions to use them
___